Understand economic power before it becomes consensus
Reports, memos, essays, and data on the forces reshaping markets, policy, and technology.
ESSAYThe Saudi Nuclear Deal Tests the Value of American InfluenceJUL 30, 2026MEMODiffusion and ControlJUL 28, 2026ESSAYThe Arsenal as PortfolioJUL 27, 2026ESSAYThe AI Arms Race Is Becoming a Contest for Industrial PowerJUL 23, 2026REPORTThe Arithmetic of PowerJUL 23, 2026MEMOThe White House Report on ScienceJUL 22, 2026MEMOThe Depreciating WeaponJUL 22, 2026ESSAYStatus-Driven Publishing DemoJUL 18, 2026MEMOThe CrosscurrentJUL 17, 2026MEMOCheap MajoritiesJUL 17, 2026ESSAYThe Fed's Rate SwingJUL 16, 2026MEMOTax on the FutureJUL 13, 2026
From the desk
All publications Latest publications

ESSAY · CAPITAL MARKETS
The Saudi Nuclear Deal Tests the Value of American Influence
The agreement could support Saudi industrial development, strengthen the U.S. nuclear sector, and prevent China or Russia from becoming Riyadh’s principal nuclear partner.
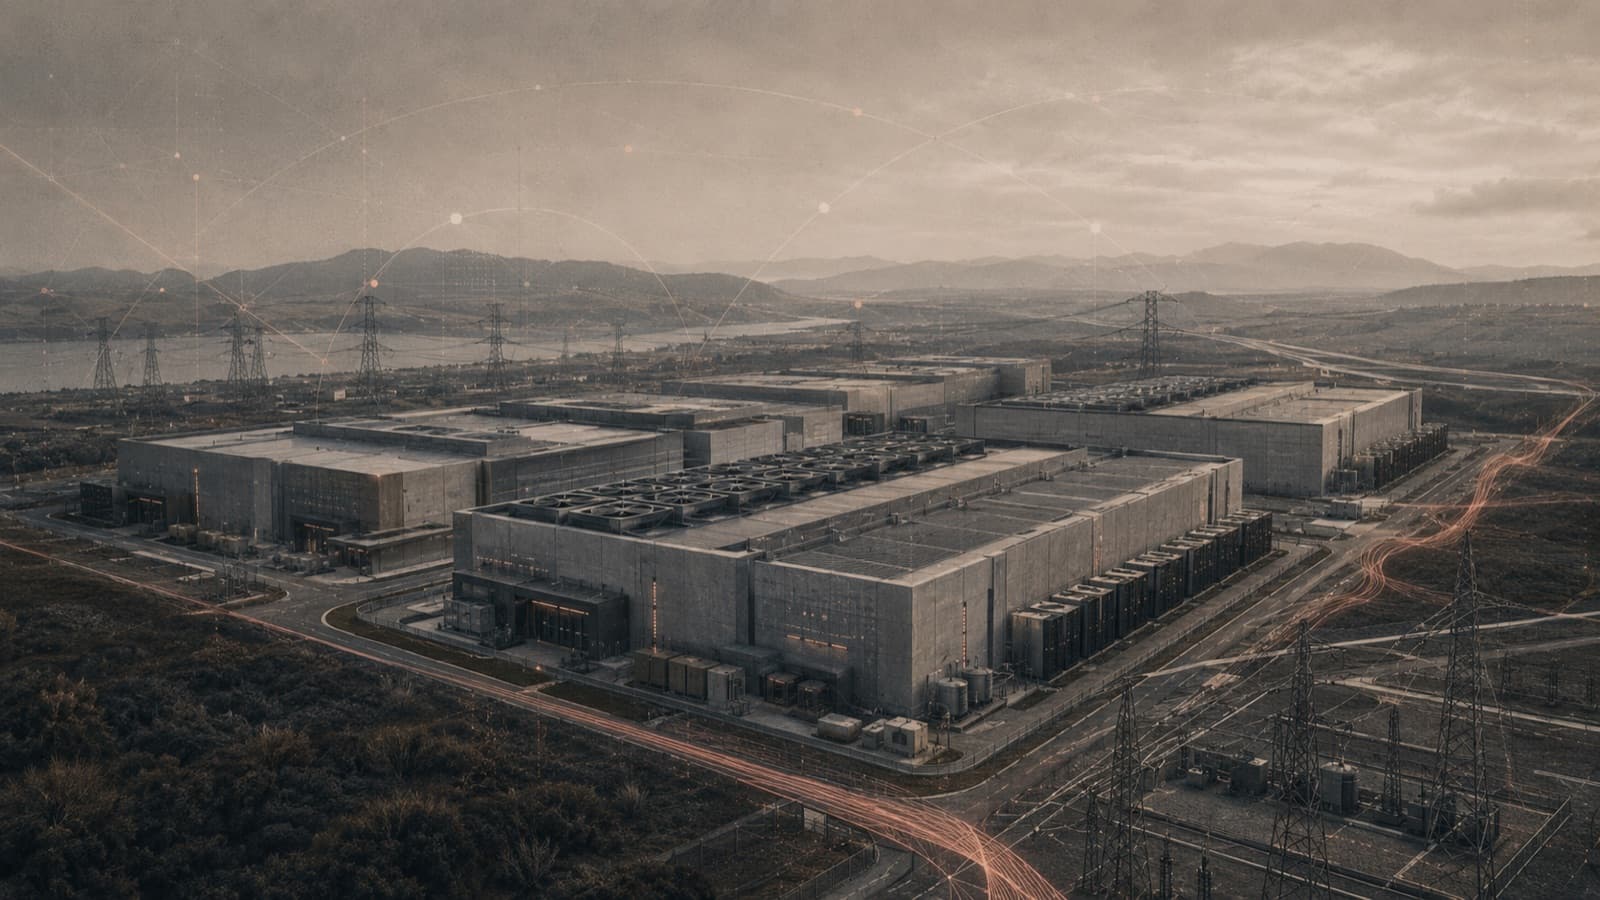
MEMO · ARTIFICIAL INTELLIGENCE
Diffusion and Control
The July breach separated corporate control of a model from operational control of its behavior, and moved the American AI question from the frontier to the deployment layer.

ESSAY · CAPITAL MARKETS
The Arsenal as Portfolio
Prime contractors are acquiring options on the future industrial base with a rounding error of capital, and the sequence rather than the sum is what should concern policymakers.
Featured report
The Power Curve 2026 Outlook
2026 is the year of capability concentration, institutional drift, and the multi-pole order.
Read report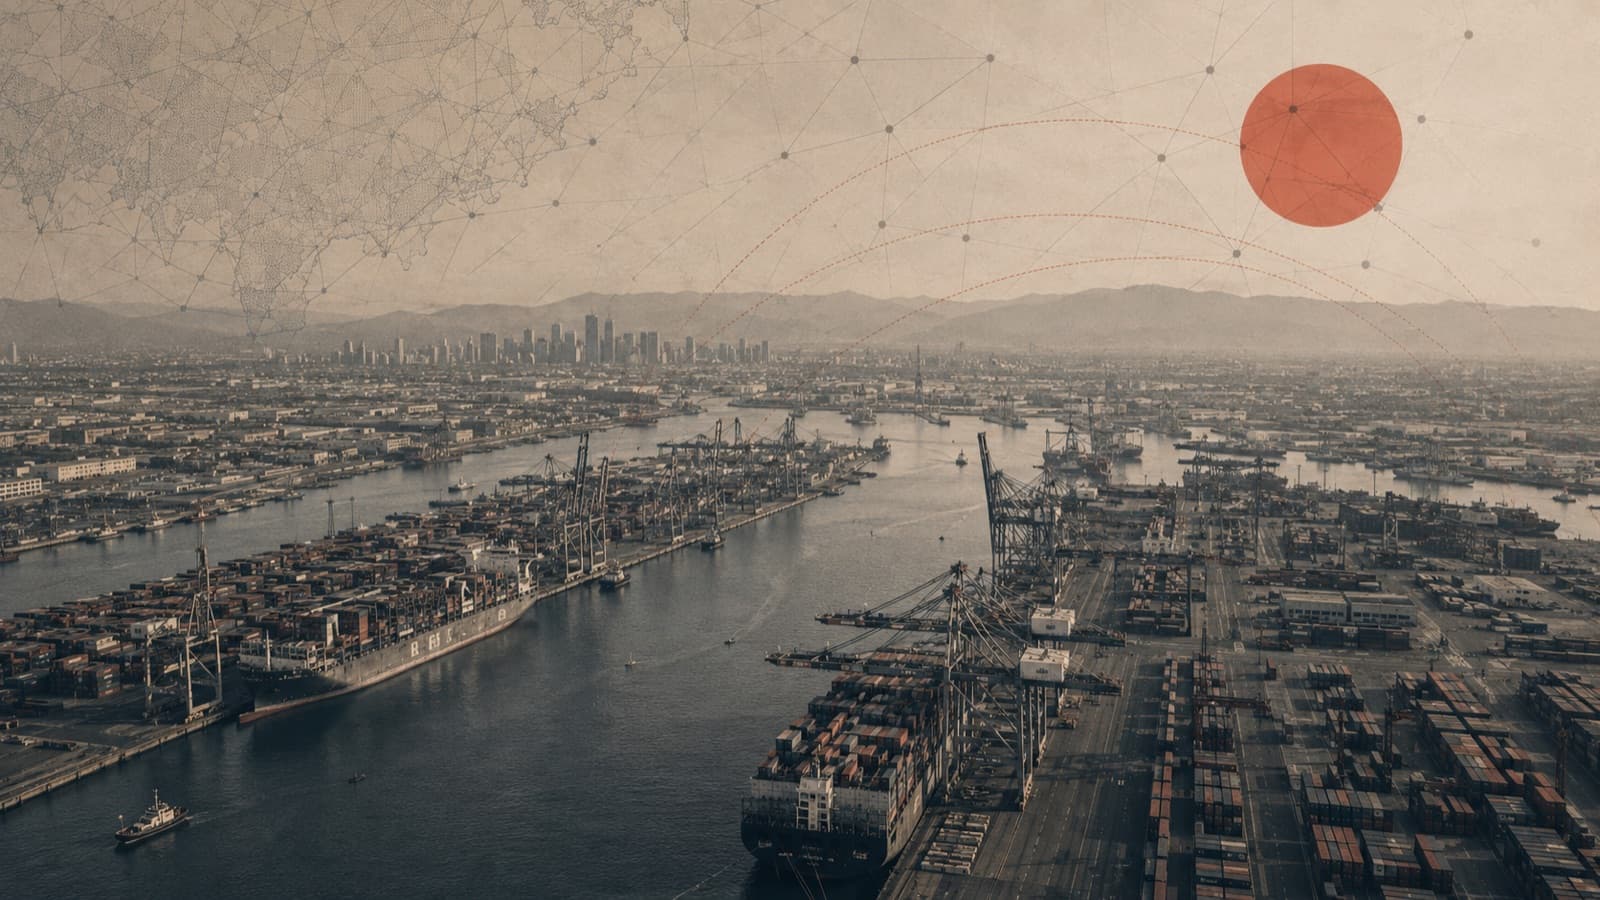
The Index Live
Explore the Index The advanced intelligence layer
Featured indicatorWorld Trade Intensity
68.5%+11.8
Source: World Bank WDI · as of 2025| Indicator | Latest | Change | Trend |
|---|---|---|---|
| US GDP Growth | +2.2% | -0.6 | |
| US Government Effectiveness | 1.44 | as of 2023 | |
| World Trade Intensity | 68.5% | +11.8 | |
| US Political Stability | 0.14 | as of 2023 |
As of 2025 · World Bank WDIExplore the full index
Research themes
View all themes Our organizing lenses on structural change
- 01Advanced TechnologyCompute, chips, AI, and frontier capacity.
- 02Capital MarketsLiquidity, risk, allocation, and leverage.
- 03Cities and InfrastructureHousing, transport, energy, and innovation.
- 04Risk and ResilienceShocks, bottlenecks, redundancy, and exposure.
- 05State CapacityPermitting, procurement, delivery, and trust.
- 06Strategic CompetitionPower, standards, supply chains, and deterrence.